
Map your moves
A visual exploration of where New Yorkers moved in the last decade
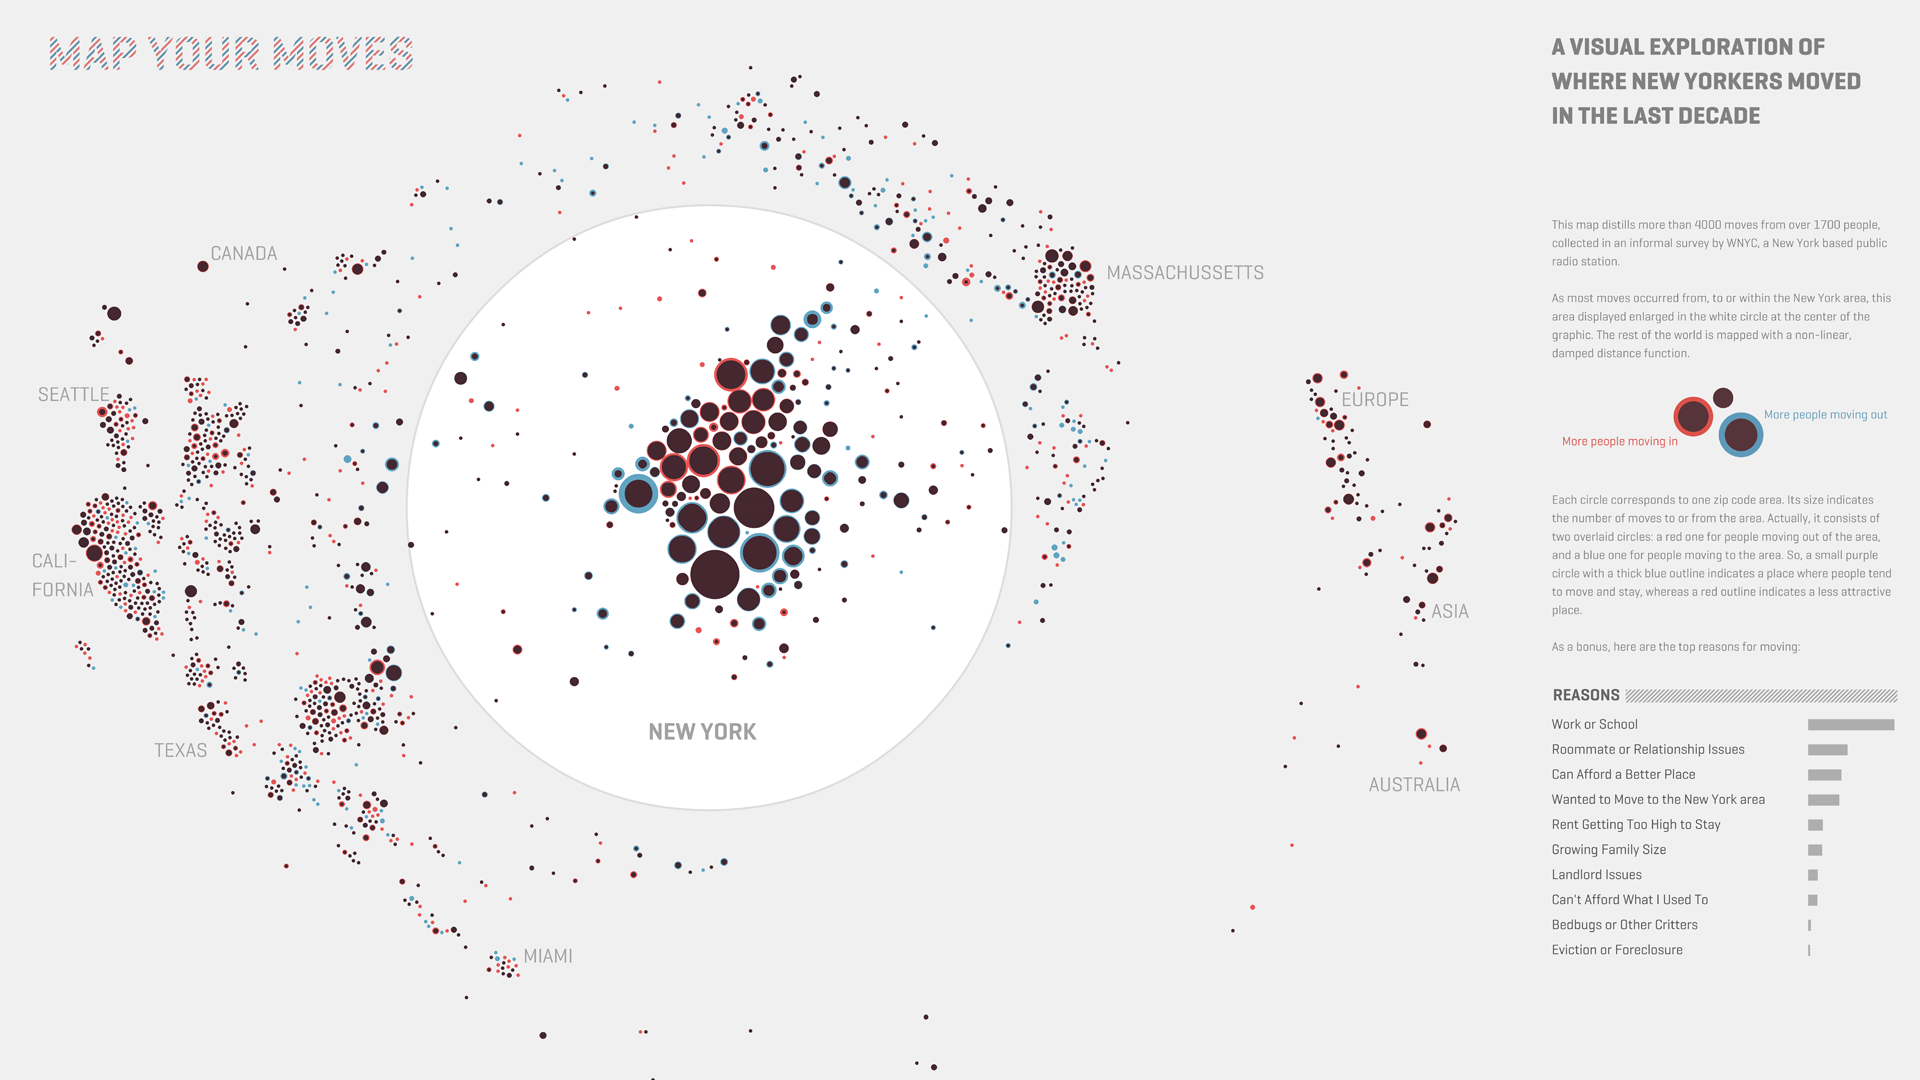
This map distills more than 4000 moves from over 1700 people, collected in an informal survey by WNYC, a New York based public radio station.
Data
This map distills more than 4000 moves from over 1700 people, collected in an informal survey by WNYC, a New York based public radio station.
For generating the geo–coordinates from the entered ZIP codes, I used the free bulk geocoder at gpsvisualizer.com. I did not check every single data row in detail, so a few of the moves might be misrepresented.
Mapping
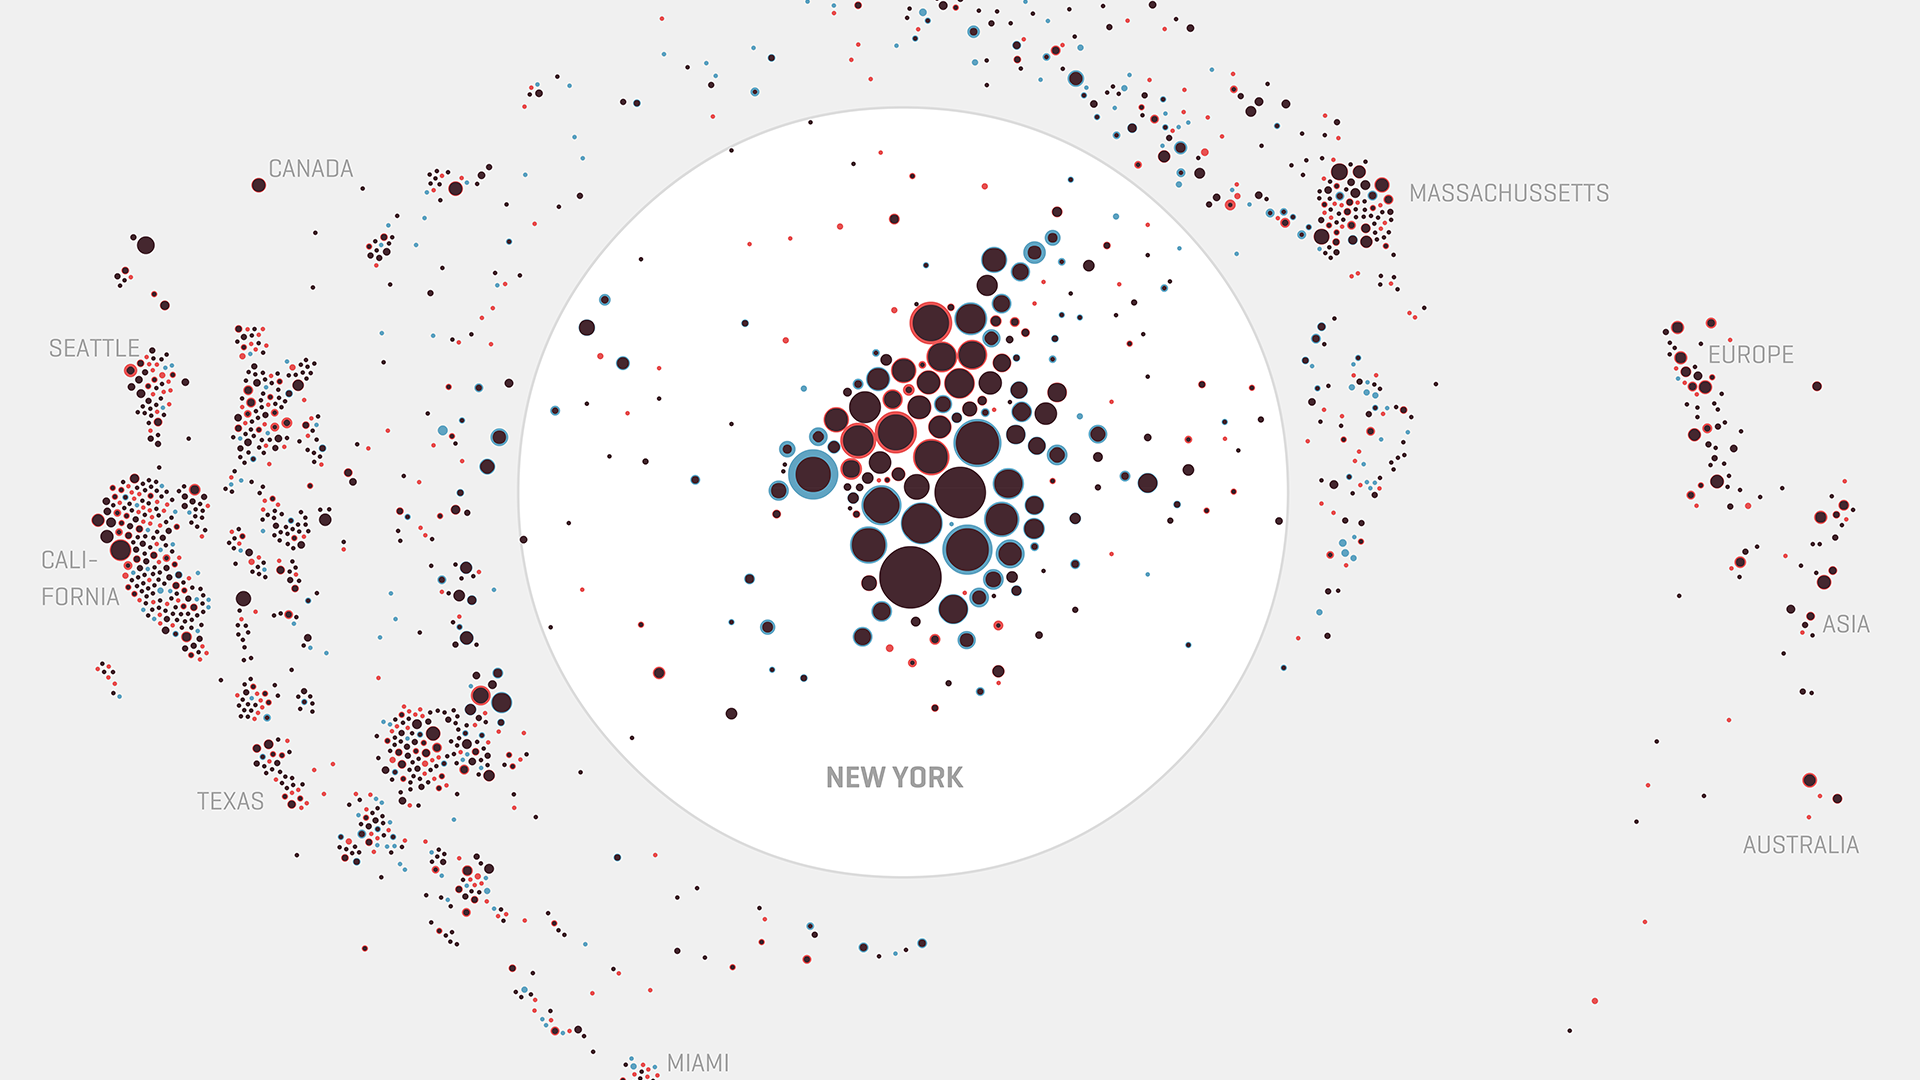
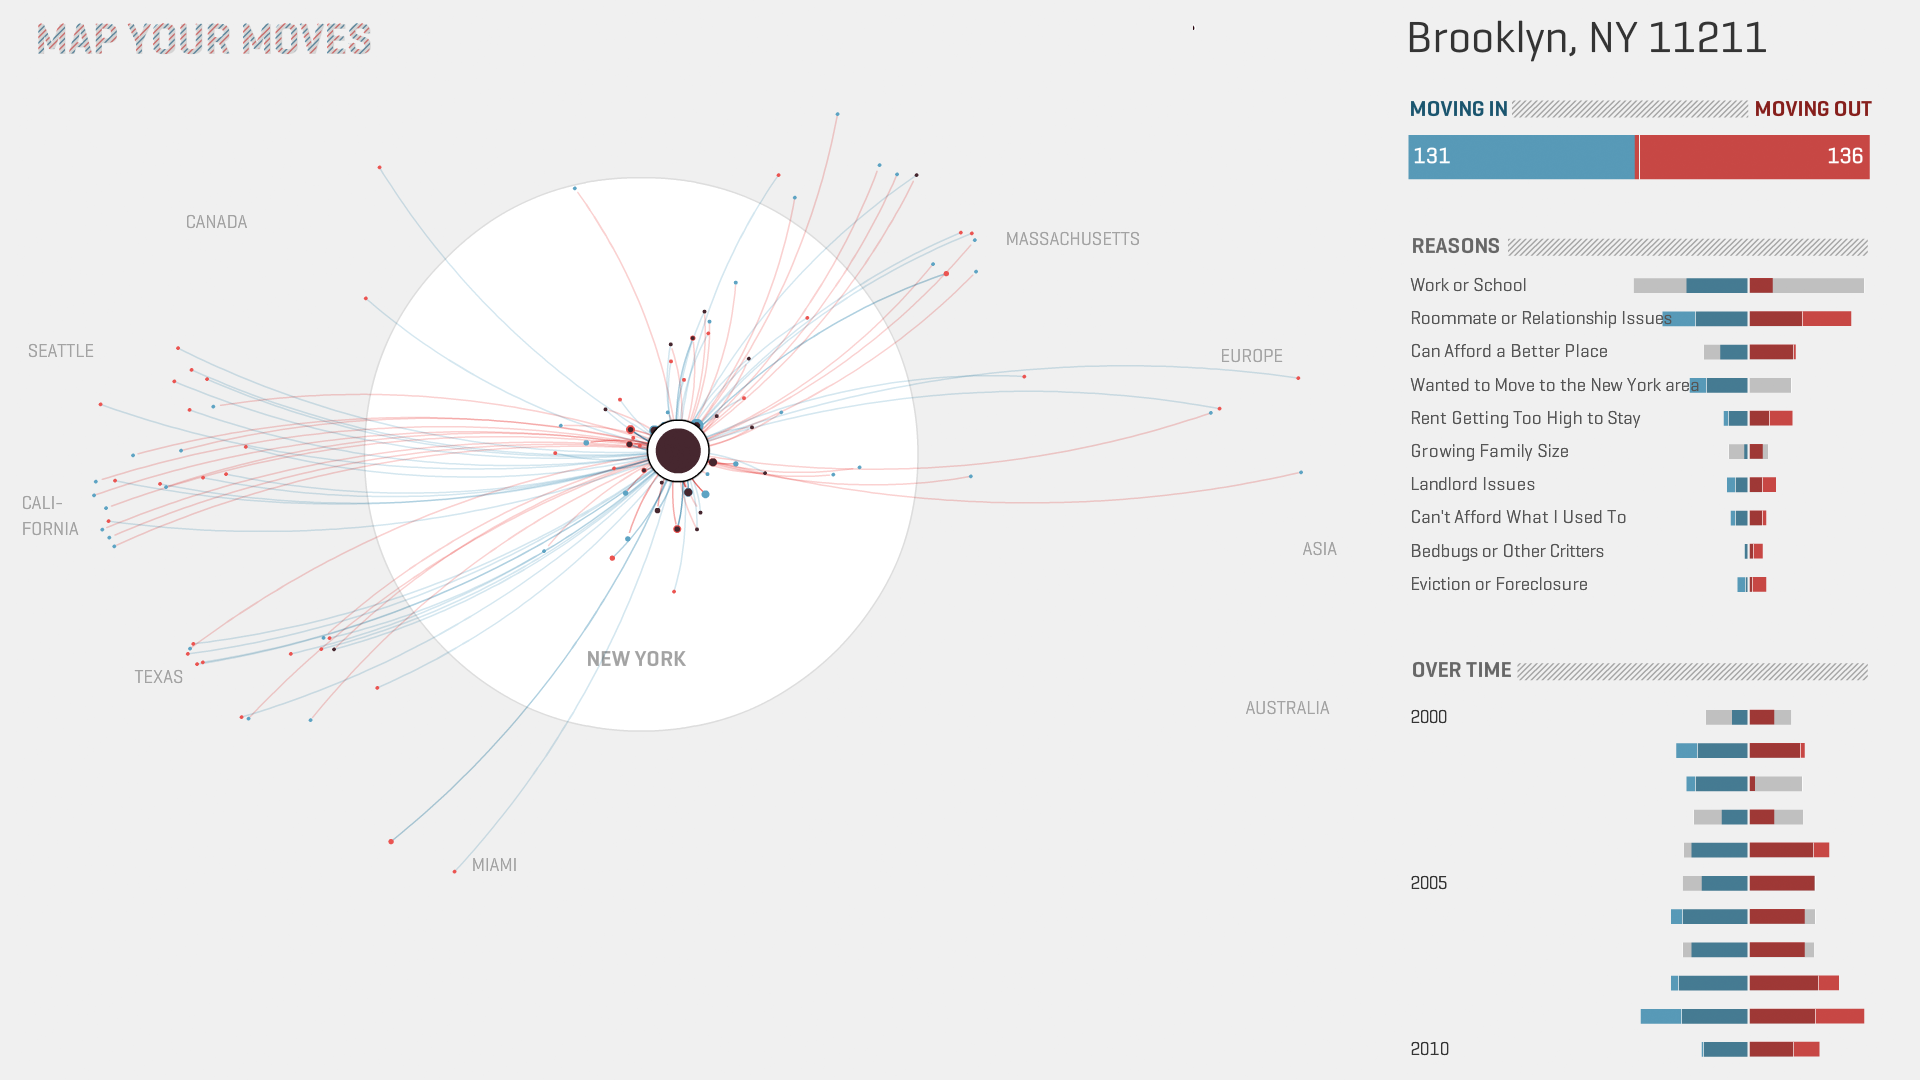
As most moves occurred from, to or within the New York area, this area displayed enlarged in the white circle at the center of the graphic. The rest of the world is mapped with a damped distance function, in order to fit everything into one screen without losing too to white-space.
Visual markers
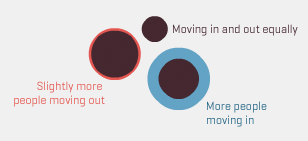
Each circle corresponds to one zip code area. Its size indicates the number of moves to or from the area. Actually, it is consists of two overlaid circles: a red one for people moving out of the area, and a blue one for people moving to the area. So, a small purple circle with a thick blue outline indicates a place where people tend to move and stay, whereas a red outline indicates a less attractive place.
Interaction
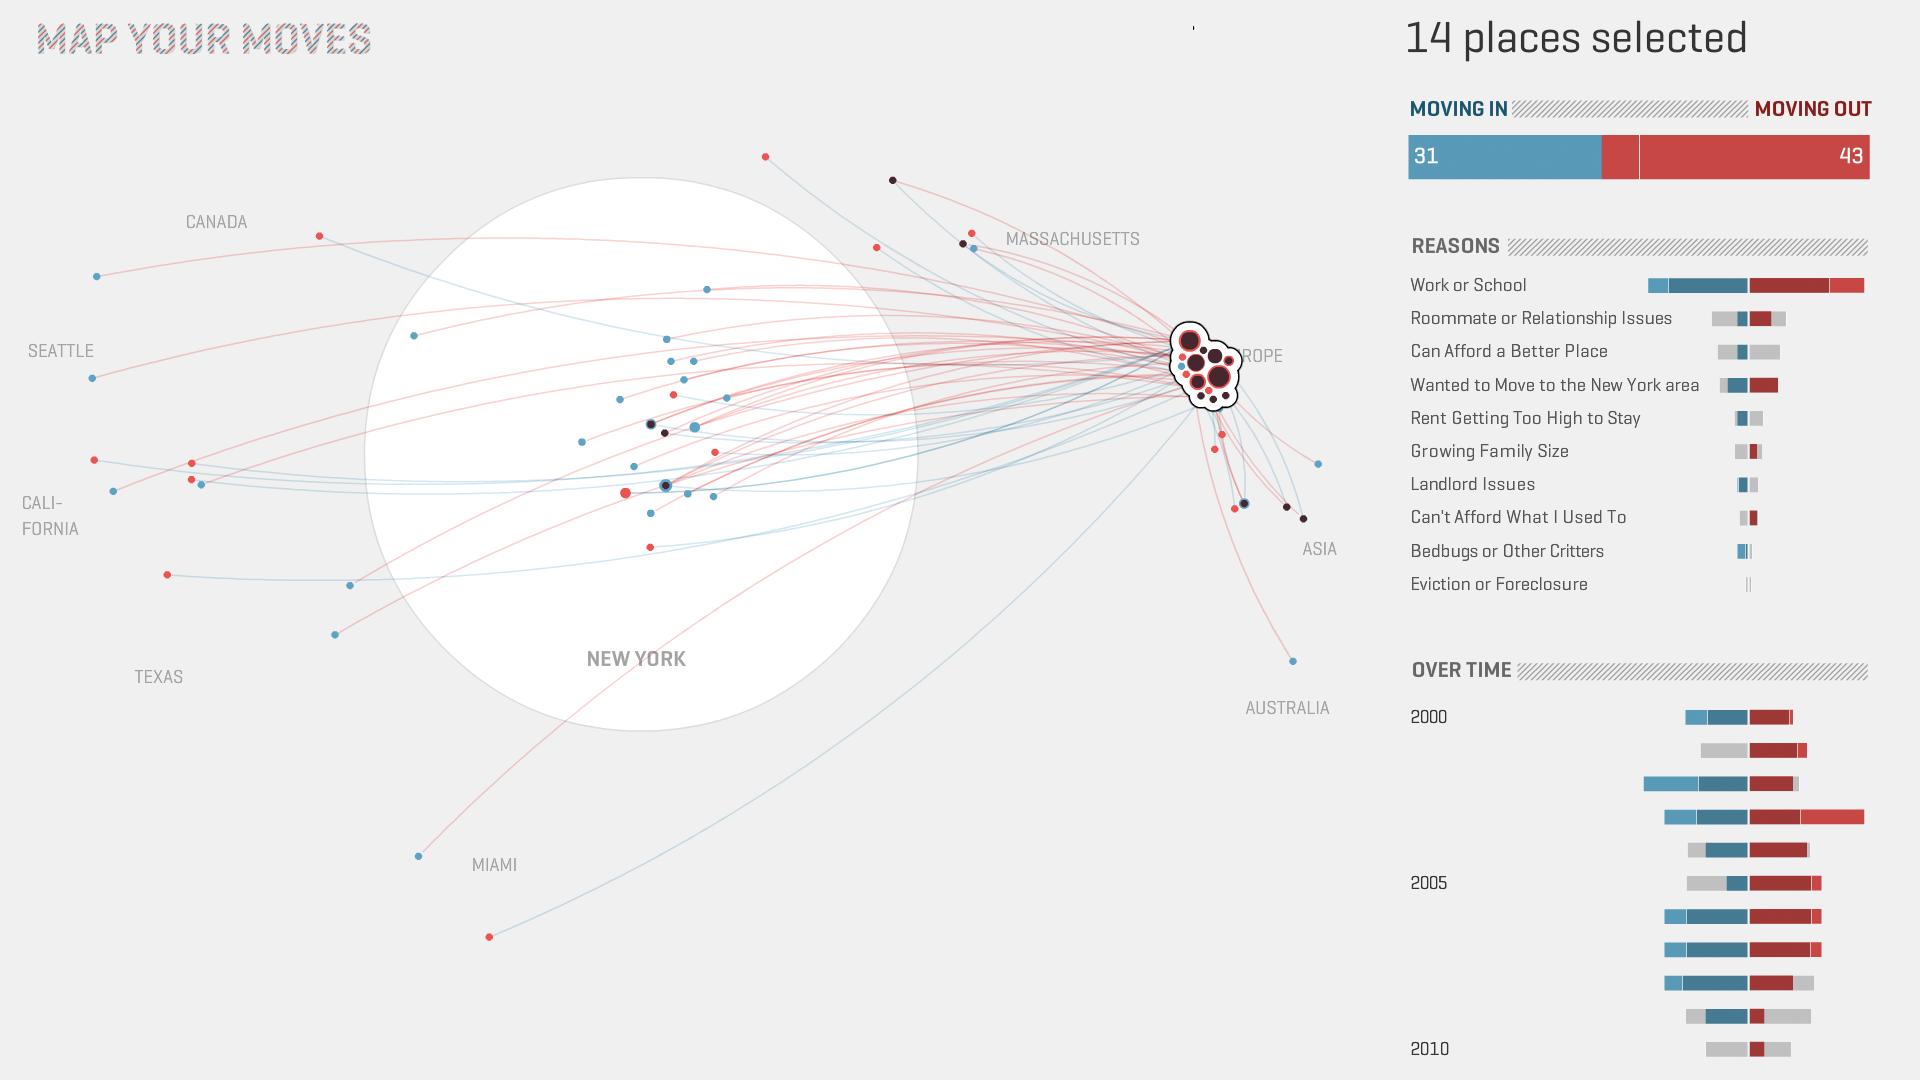
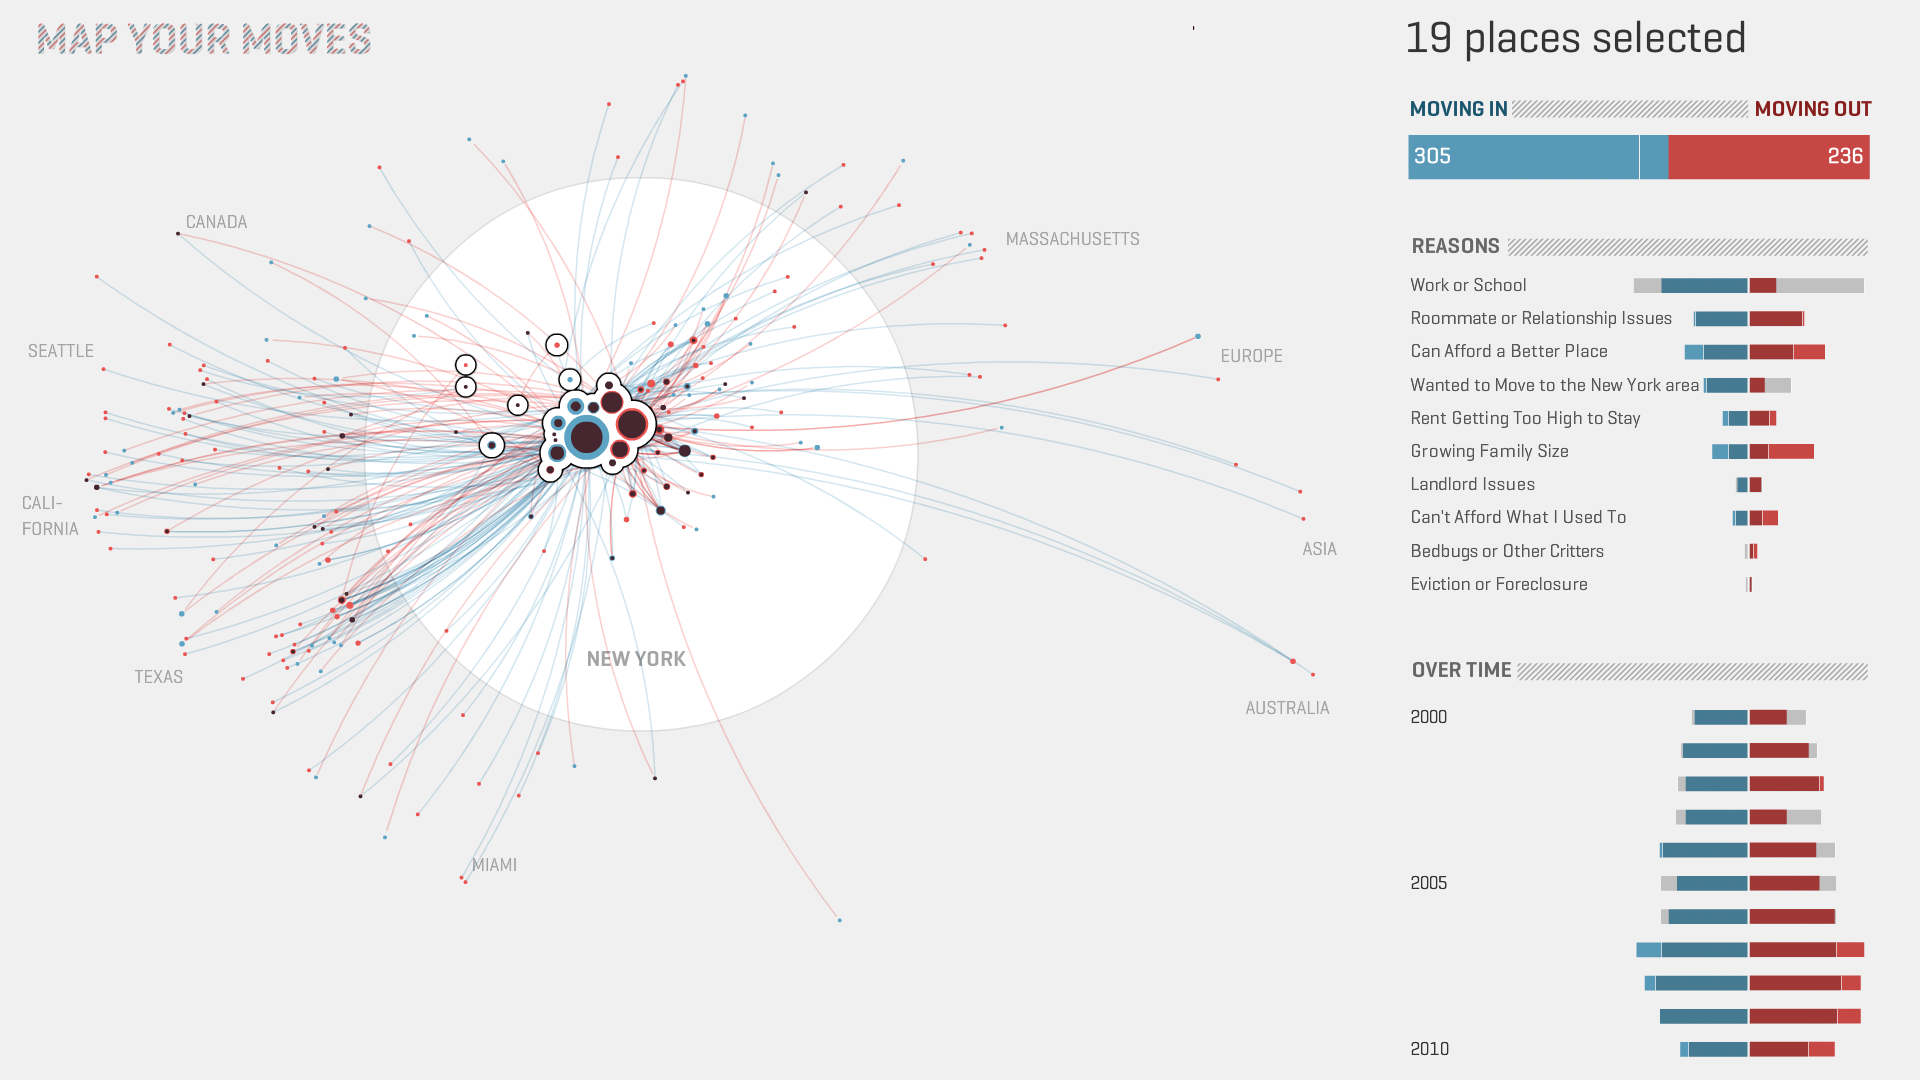
Click one of the circles to inspect only moves to or from this area. Or, to inspect a whole cluster of areas, drag to create a radial selection bubble. To clear your selection, click on the background. Moves to a selected place are indicated with a blue line, wheres moves from a selected place are drawn in red.
Details
On the right, you can find some statistics on why and when people moved to the selected areas.
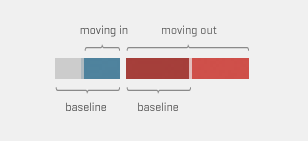
You can directly compare the lengths of the red (for people moving away from the selected areas) and blue (for people moving to the selected areas) bars to spot trends and peculiarities. Moreover, you can compare these values to the baseline (overlaid in grey), which indicates the relative proportion when we consider at all moves. If, for instance, the blue bar for "landlord issues" is smaller than the red bar, this means that the selected area has a relatively low fraction of people moving away because of landlord issues.