
BikeNetKit
From network science to planning tools

The NERDS group at the IT University of Copenhagen has spent years on what they call the science of bicycle networks: algorithms that compute where a network should grow next, which gaps hurt most, how fragmented pieces connect best, and where calm neighbourhoods could be carved out of a street grid. The results lived in papers and in two early prototypes, growbike.net and fixbike.net.
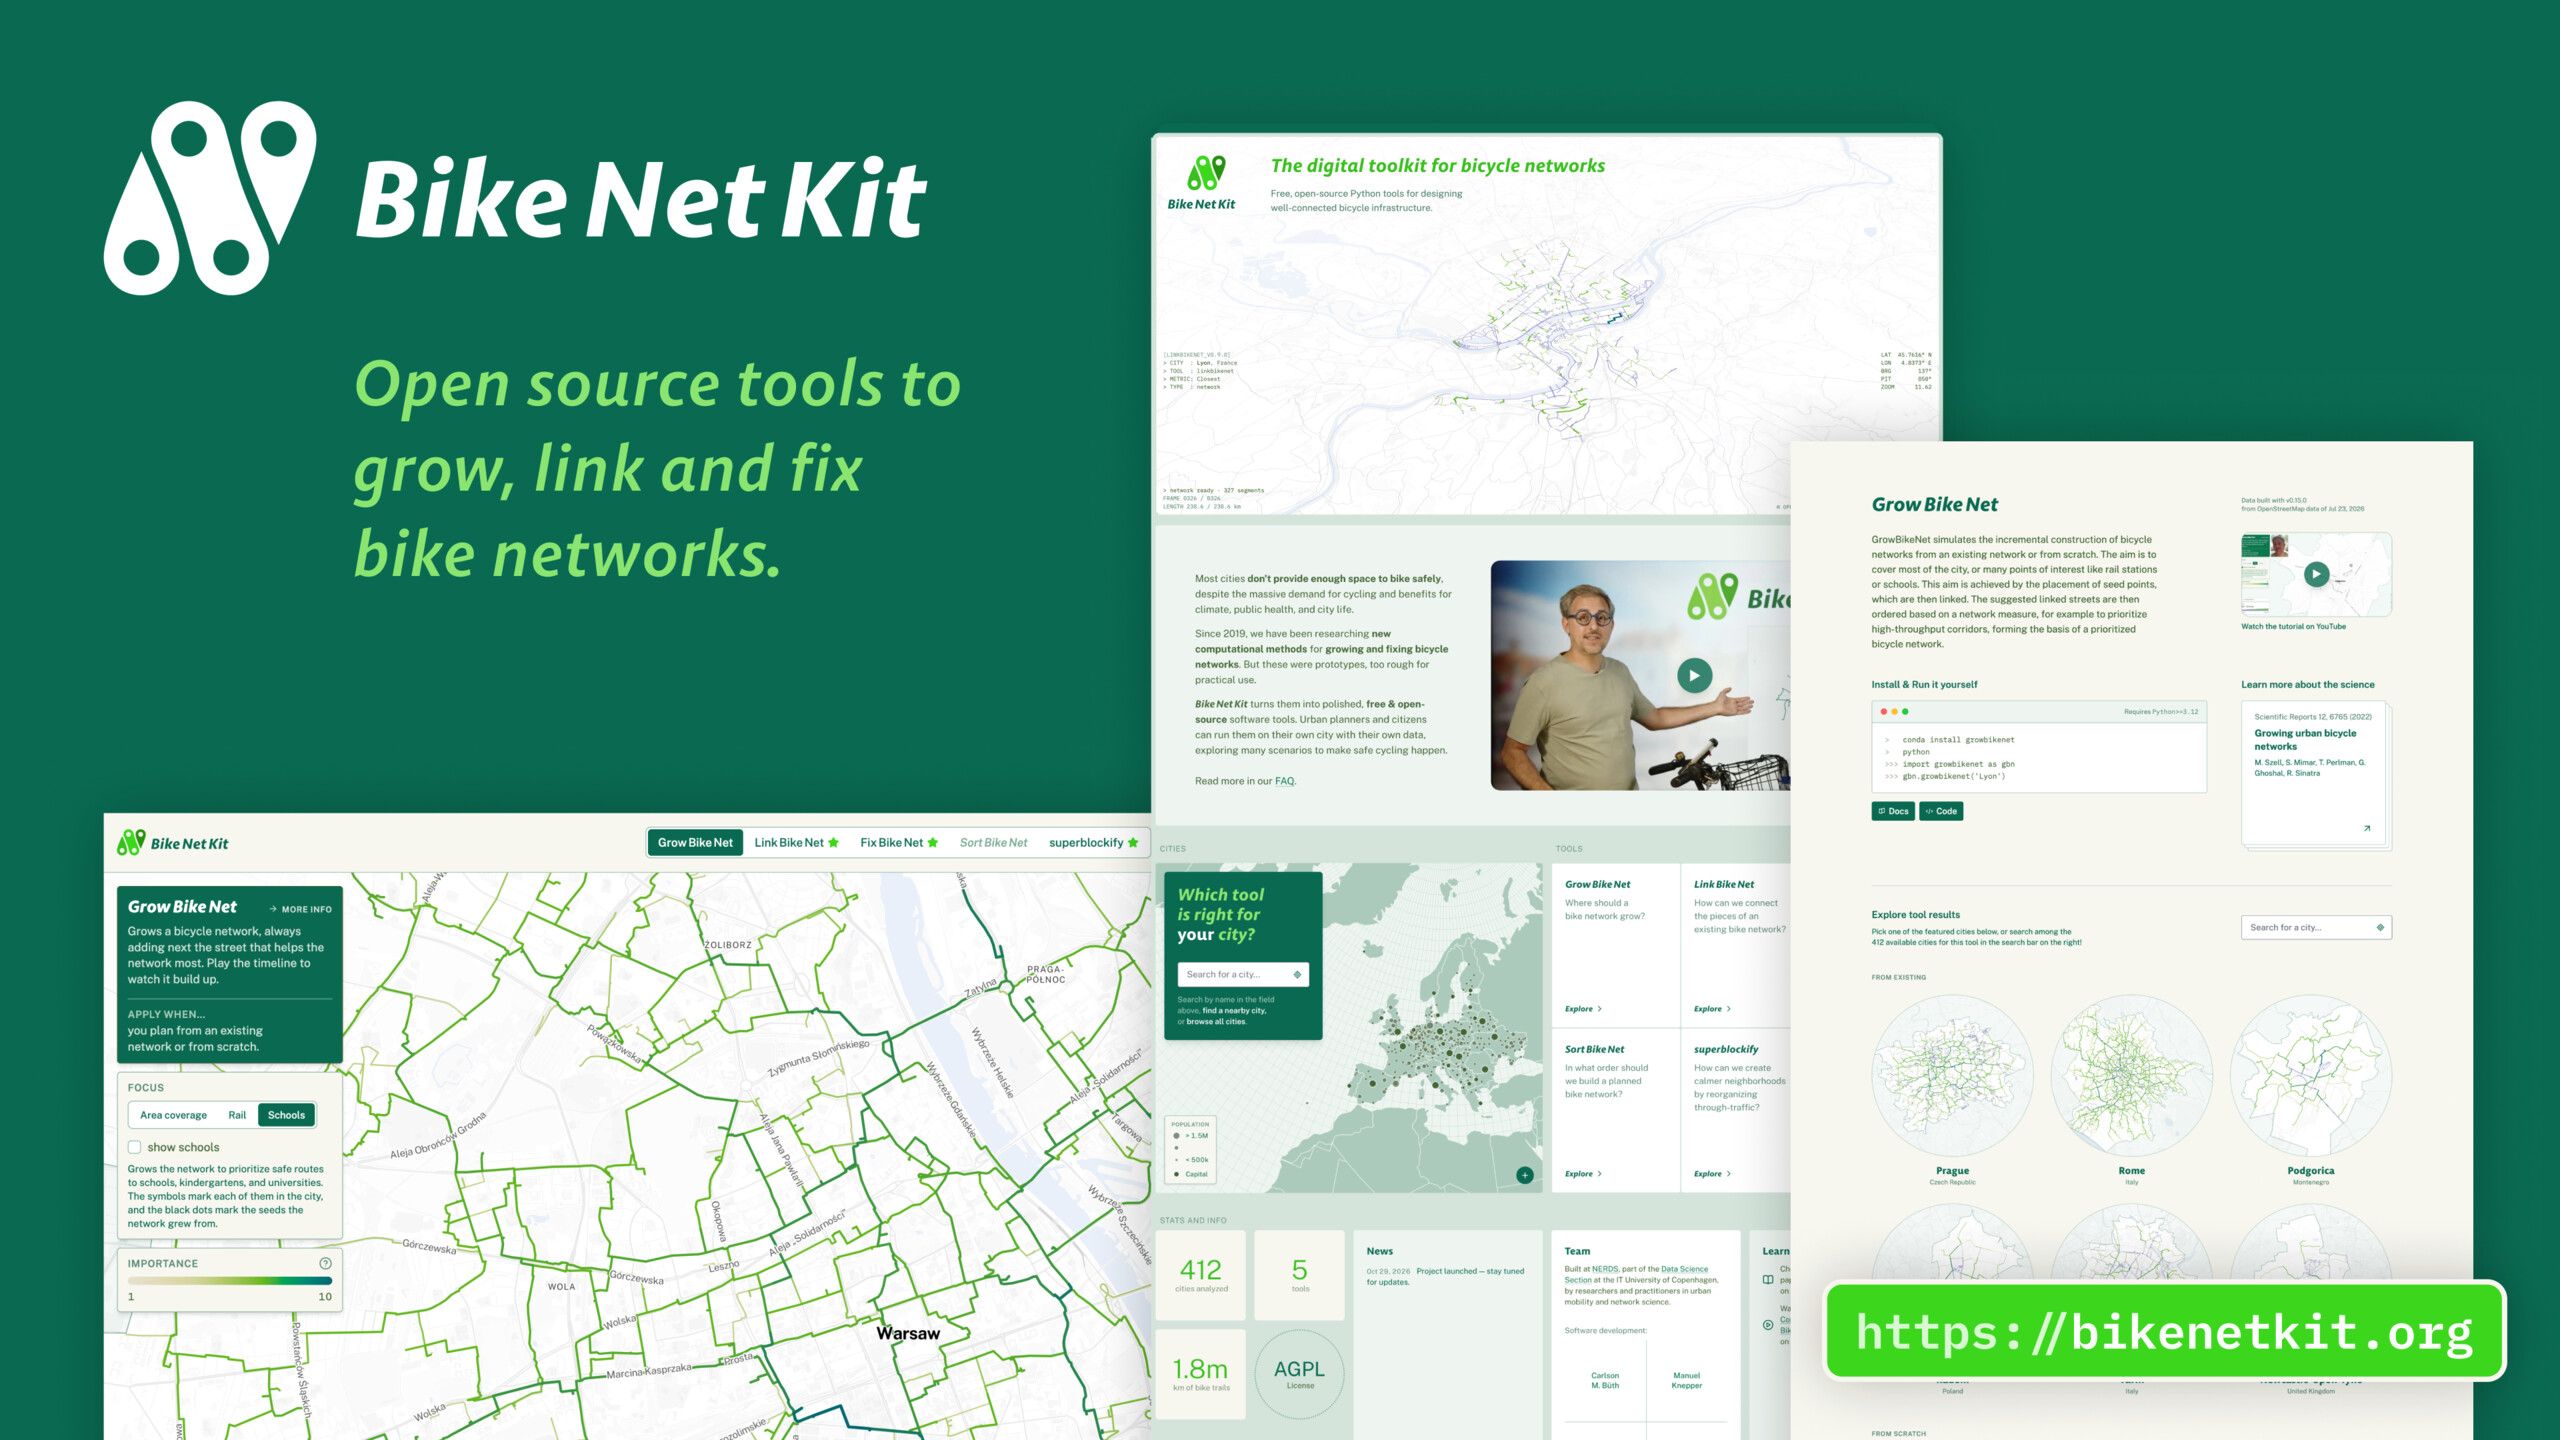
Over 2026, I worked with Michael Szell and his team to turn this into a public platform. My part covered the concept and information architecture, the visual identity built around Andreas Brietzke’s logo, the design of the maps and tool interfaces, and the full front-end implementation, plus the tooling that renders screenshots and videos from the same code base.

Maps for specific city-planning questions
Each tool answers one planning question, and each gets the same kind of page: a short explanation, the research paper behind it, instructions for running it on your own data, and the interactive results for the cities it covers.
- GrowBikeNet: where should a bike network grow, from scratch or from what already exists?
- LinkBikeNet: how can the fragmented pieces of a network be joined up?
- FixBikeNet: which gaps should be closed first?
- SortBikeNet: in what order should a planned network be built? So far for Paris, where the plan can be played in different orders, including the one the city actually built.
- superblockify: where could through-traffic be reorganised into calmer neighbourhoods?

The maps share one interaction model. All results are computed in advance by the Python tools. A timeline plays through the build order of a network step by step, while the legend and the kilometre counters update. Every segment carries a score from 1 to 10 for its importance, gap severity or connectivity gain, and the colour ramp follows that score. Settings in the sidebar switch between seed points (an even grid, rail stations, schools), ranking metrics (betweenness, closeness) and starting networks.

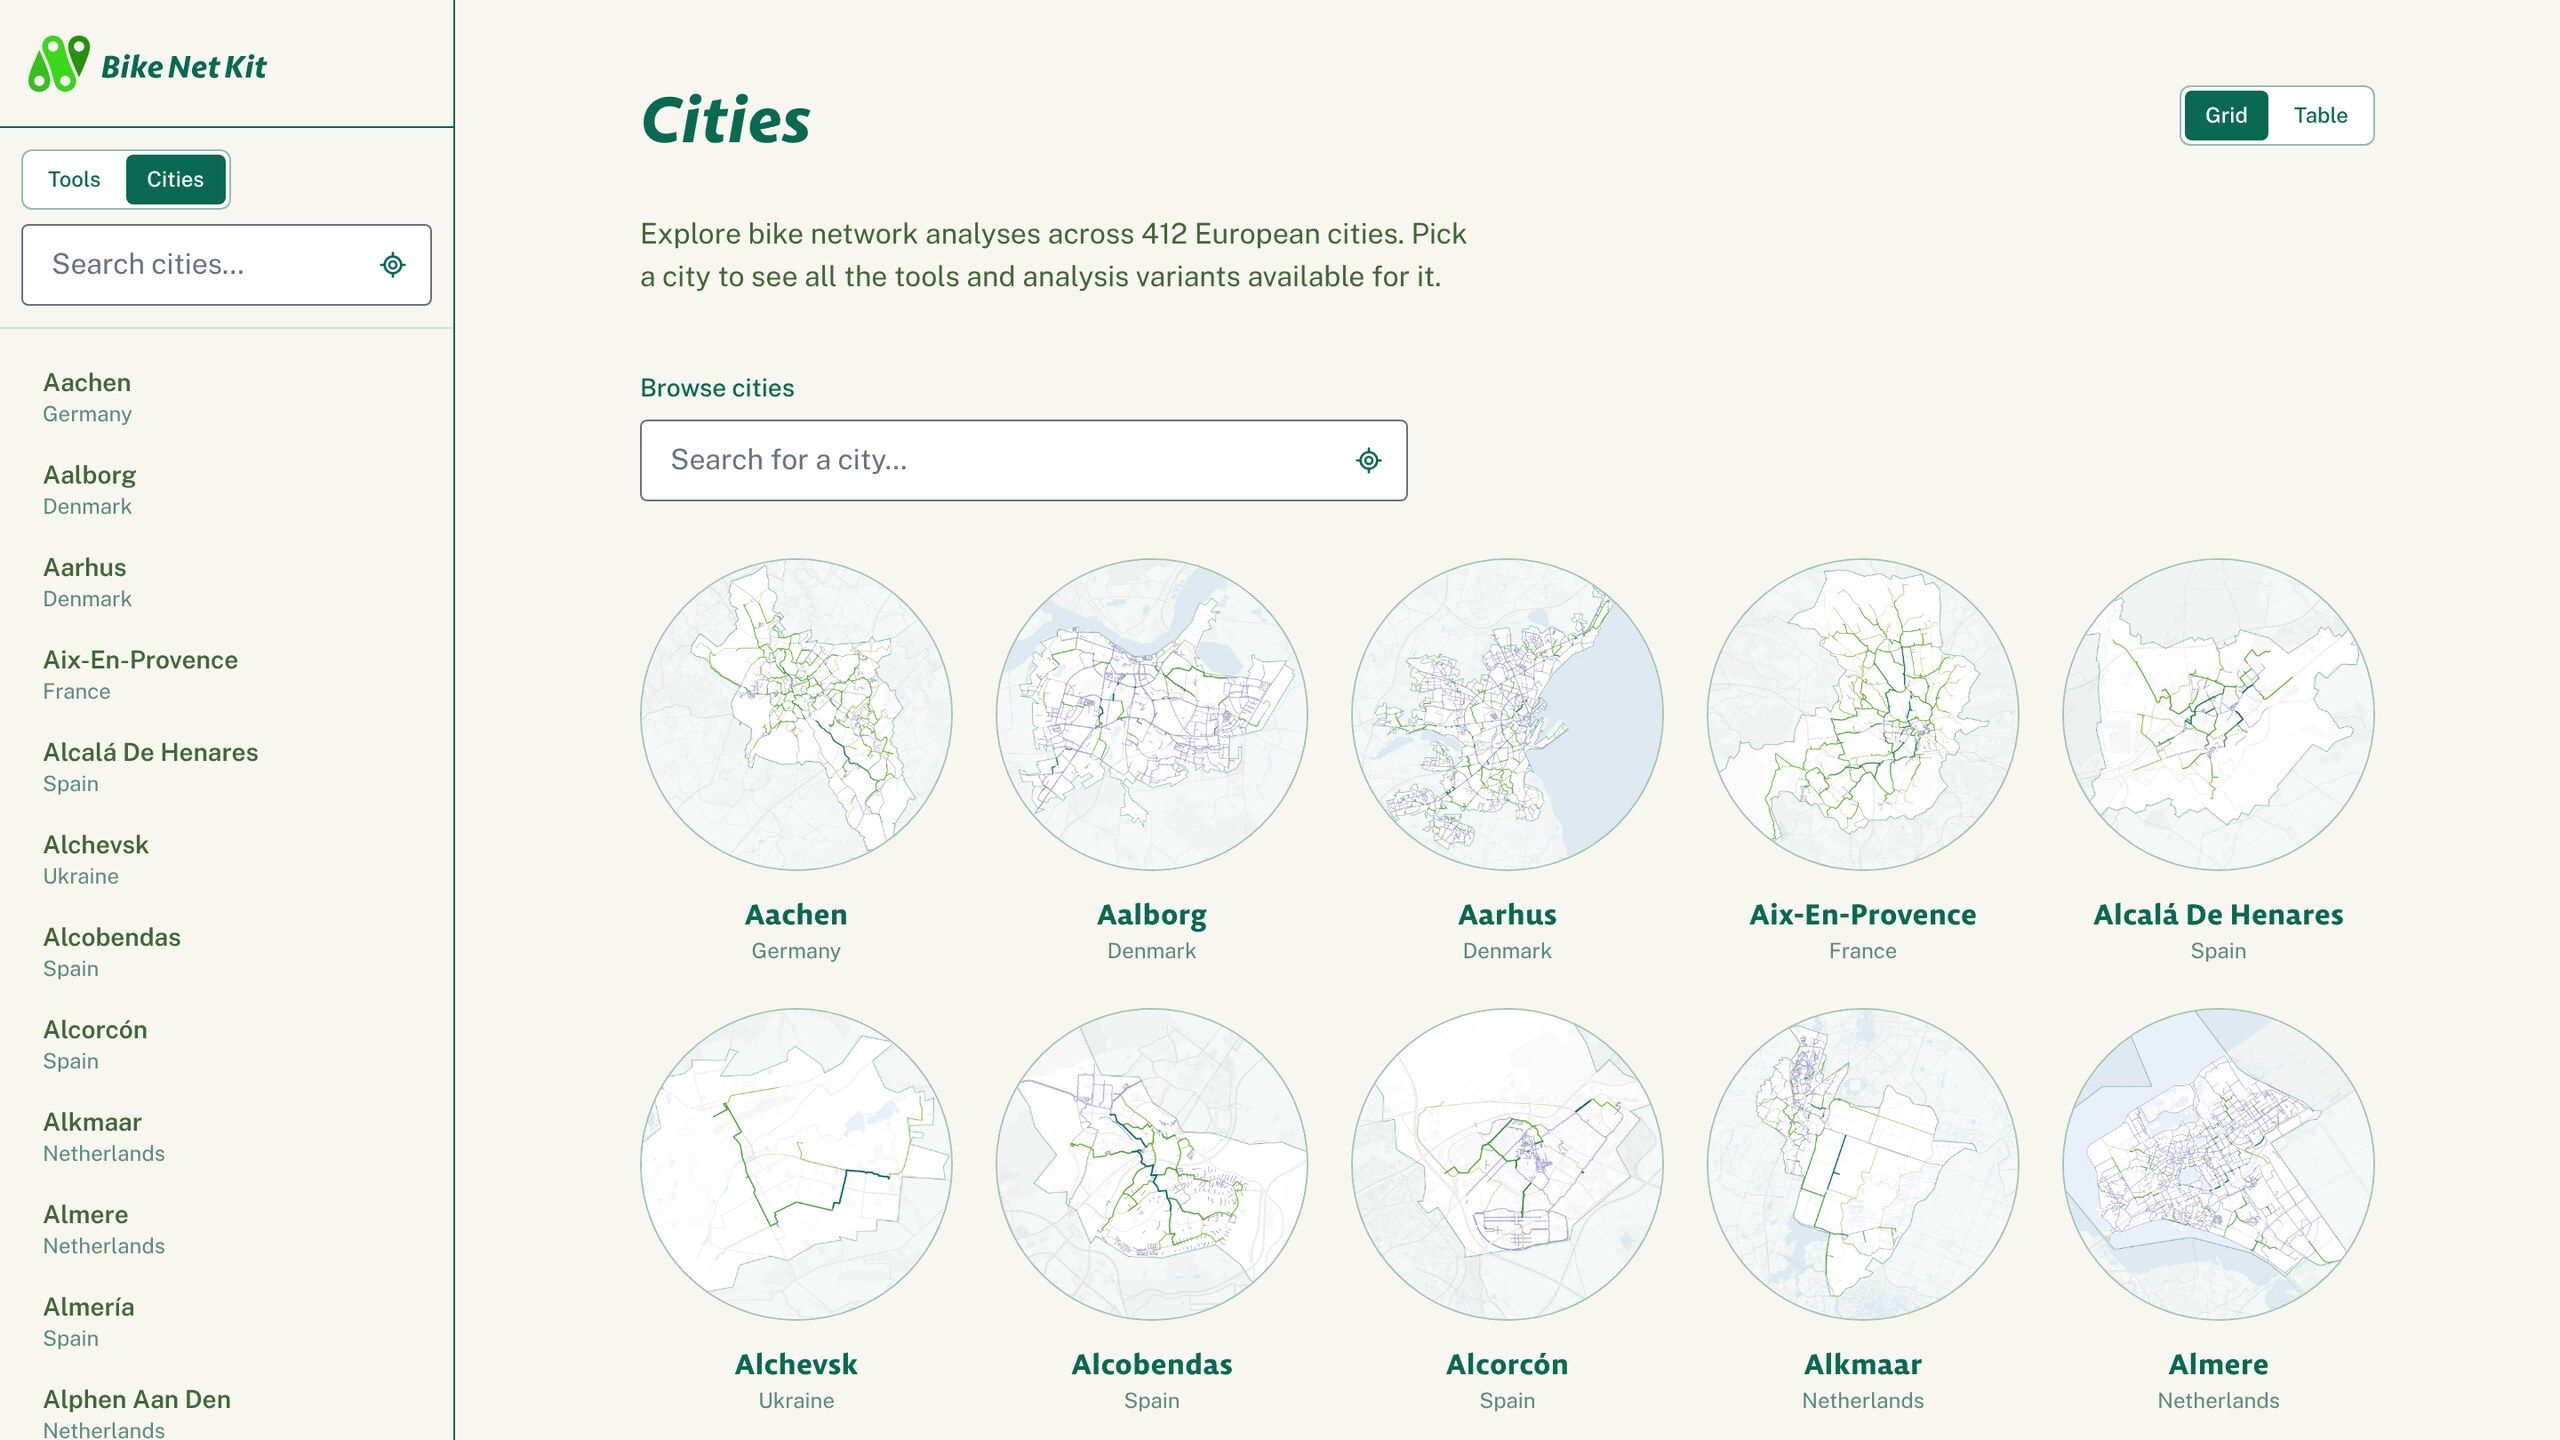
Every map can be downloaded as PNG, SVG or GeoJSON, opened as a data table, embedded in another site, and shared by URL, since city, tool and settings are all part of the address. A “Take action” panel links to the city’s cycling organisations, the municipality and the national transport ministry, so that what you see on the map has somewhere to go.


Visual language

The design language for the project is documented on bikenetkit.org/design. This page renders every colour token, type setting and UI component from the same CSS the site runs on, so it cannot drift from what is deployed. There is also a coding-agent-friendly DESIGN.md and a design token file, which make it easy to use the design language in different contexts.

Built to last
One requirement shaped most technical decisions: the site should work for years without maintenance. Accordingly, everything is pre-rendered, nothing loads from a third-party origin at runtime. Basemap tiles, fonts and map glyphs are self-hosted like all the GeoJSON files driving the maps. There are no cookies and no tracking scripts; usage statistics are done only from anonymized server logs.
The stack is SvelteKit with Svelte 5 and Tailwind 4, MapLibre GL JS for the maps, a self-hosted Protomaps basemap as a single PMTiles. The site is open source under the AGPL and comes with documentation for adding a city, adding a tool and editing content, so the ITU team can run and extend it on their own.
The code for the project was created using Claude Code.

BikeNetKit was launched in November 2026. Explore the tools at bikenetkit.org, read the FAQ or browse the code on GitHub.
Related

Climate—Conflict—Vulnerability Index
