Lilienthal Solargraphy
Physical data recording
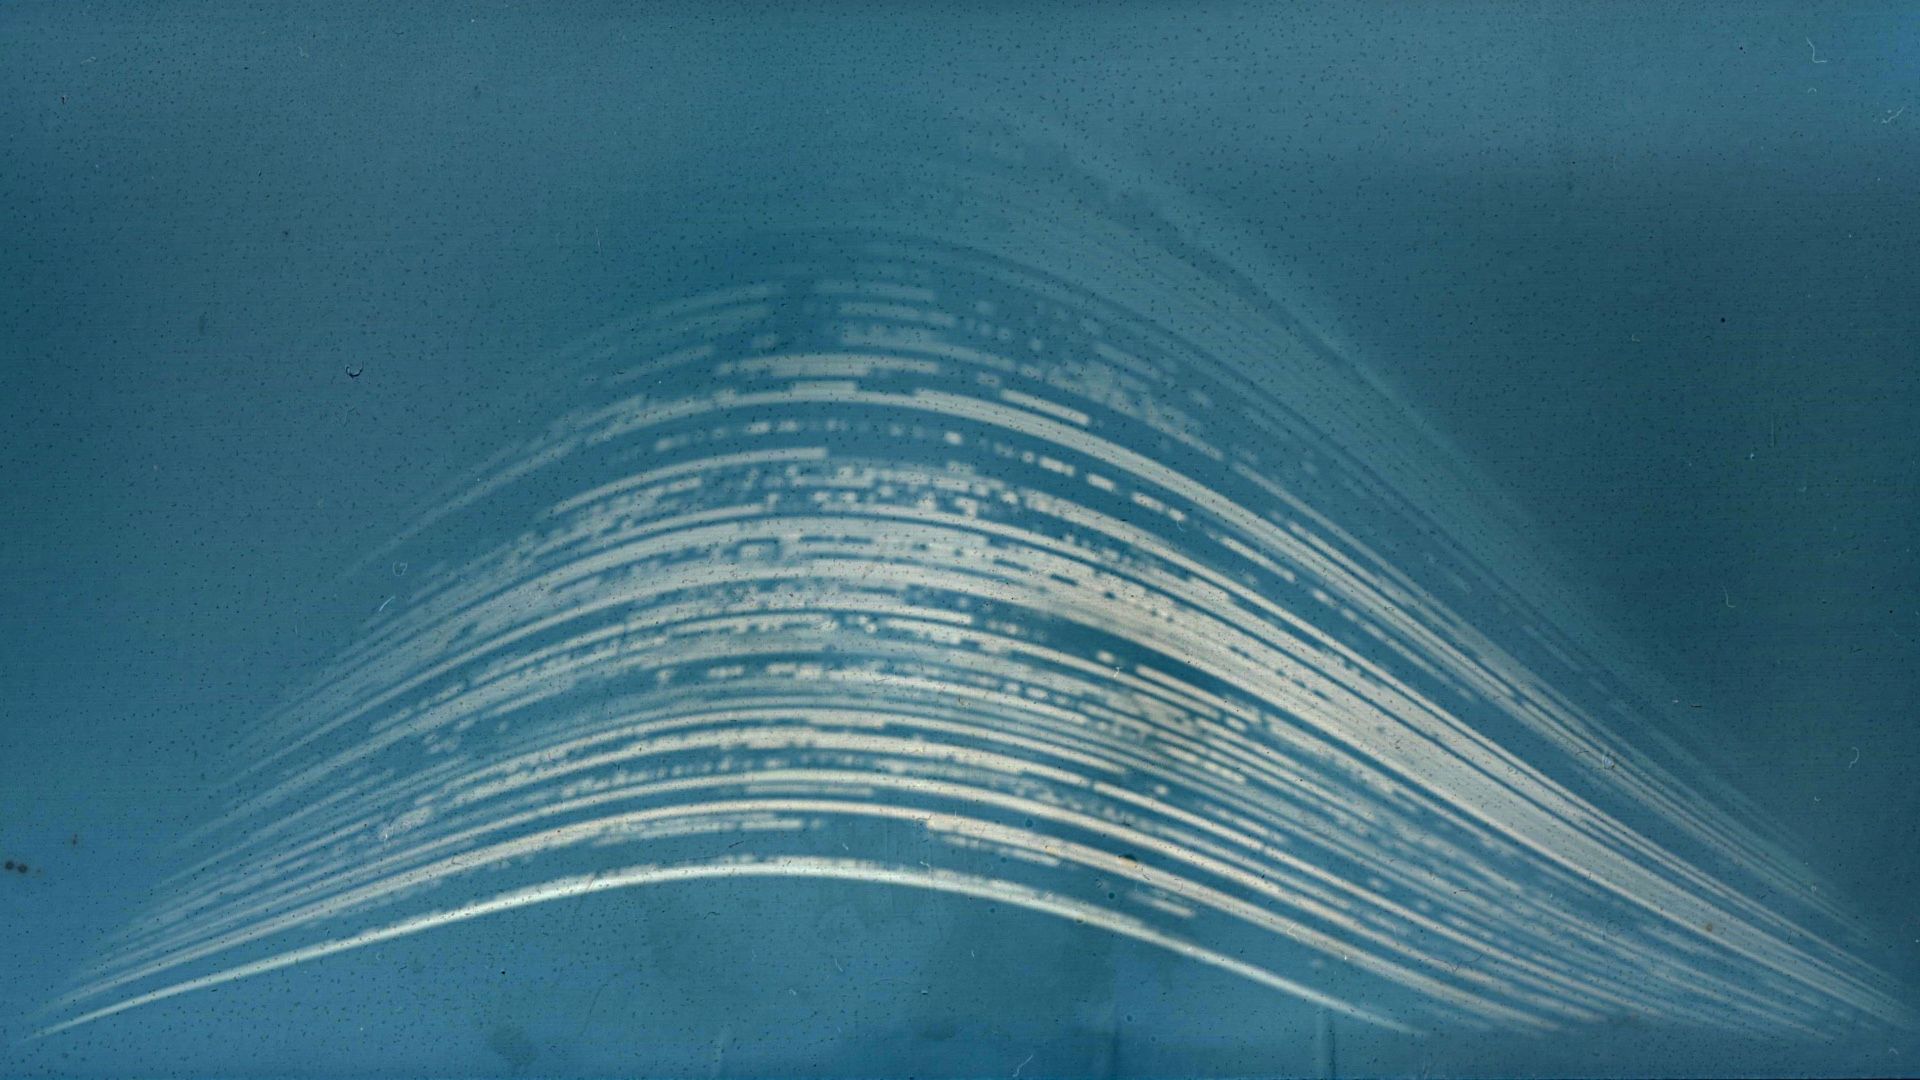
I create images of the sunlight using pinhole cameras at my home in Lilienthal, Germany. This image presents a graphical recording of the sun’s position and strength over the course of 6 months in the second half of 2022.
Exploring data-less, autographic visualizations bears a fascination for me, as it allows us to explore materiality and process behind data graphics in new ways. As a personal experiment, I set up pinhole cameras to capture the sun’s light over the course of 6 months. The resulting images are diagrammatic in nature, but were created without any data, merely through a specific physical setup.


Mathias Stahl has created remakes of the images using code. It is interesting to compare the relative qualities of the two approaches.
Related

Under the Sun
Tracing the sun zenith in realtime
There's exactly one point where the sun is at zenith, right now. A trip around the world in 24 hours — everyday anew, never quite the same. A nod to the beauty of nature, the passing of time, and a heating planet.

Beyond the bar chart
My talk at KIKK Festival 2026 in the Grande Salle of the Théâtre de Namur: Do we still need expert-designed visualizations in an age of automated chart generation?